Peter Worden – Video Series
$124.00 Original price was: $124.00.$50.00Current price is: $50.00.
Peter Worden – Video Series
Product Delivery: You will receive a download link via your order email
Should you have any question, do not hesitate to contact us: [email protected]
Peter Worden – Video Series

PETER WORDEN – VIDEO SERIES
This popular video will help you pick up key MoneyStream® concepts that will improve your ability to follow the smart money trail in the market. You’ll learn how MoneyStream relates to price through both confirming and contradictory chart patterns; Peter Worden will walk you step-by-step through many charts to provide concrete examples of favorable patterns in this unique cumulative indicator.
WHAT YOU’LL LEARN:
- What MoneyStream is trying to tell you
- How to spot both positive and negative divergences between price and MoneyStream
- How to identify ideal price and MoneyStream chart setups for both bullish and bearish trades
- Best practices in using historical charts to learn and practice a new method of indicator interpretatio
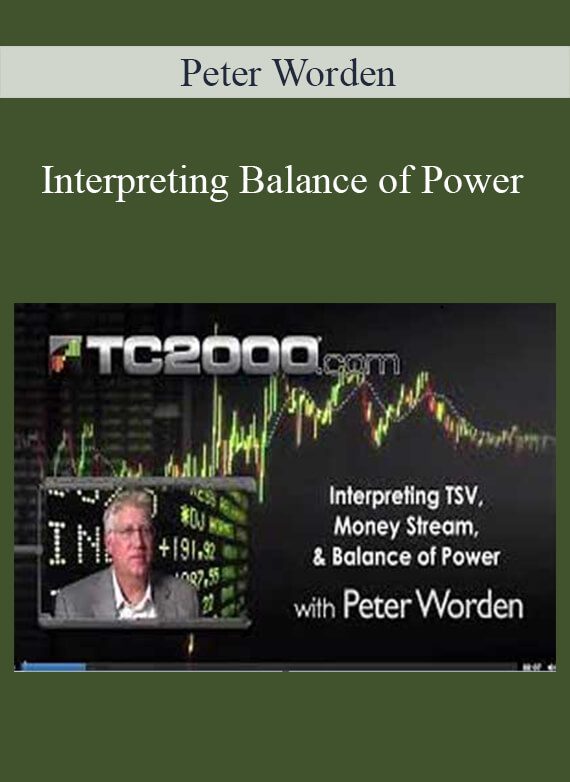
Peter Worden – Interpreting Balance of Power
Peter Worden, co-founder of Worden Brothers, teaches live at an award-winning TC2000 training class in Tampa FL. He delves into the interpretation techniques for Worden proprietary technical indicators Time Segmented Volume, MoneyStream and Balance of Power created by his father, Don Worden. Peter demonstrates how to use these indicators to establish the primary bias of a stock by ferreting out what the ‘smart money’ is currently doing. By walking through the indicator development in chart setups of actual stocks Peter helps you learn the basic principles for practical application of these exclusive TC2000.com indicators on the stocks you follow and trade.
WHAT YOU’LL LEARN:
- What each of the proprietary indicators are telling you about price movement
- How large block trading impacts the flow of stocks
- The role of divergence in understanding these indicators
- What constitutes bullish or bearish behavior
- How important are moving averages in relation to these indicators
- Examining the quality of buying or selling in price moves
Peter Worden – Scanning & Sorting with MoneyStream
This video builds on the foundation laid in Peter Worden’s video “Interpreting MoneyStream”. Here, Peter offers a step-by-step lesson in how to quickly acquire a list of all charts with stand-out bullish and bearish MoneyStream® patterns using TC2000’s EasyScan tool.
WHAT YOU’LL LEARN:
- How to analyze MoneyStream-related tabular data to find charts of interest
- How to use EasyScan to create narrow watchlists of both bull and bear trade candidates based on MoneyStream behavior
- How to implement Peter’s MoneyStream analytics to find the best possible MoneyStream chart patterns in the market
Peter Worden – Interpreting Time Segmented Volume
In this video you will learn to interpret the meaning of price movement relative to Time Segmented Volume® (TSV). Peter Worden explains how to choose settings for the indicator that are most appropriate to your trading style and teaches you to use confirming and contradictory indicator behavior to make educated trade decisions. You’ll learn to spot major price tops and bottoms using indicator patterns that have a tendency to precede character changes in price.
WHAT YOU’LL LEARN:
- How to incorporate Time Segmented Volume into your charting routine
- What TSV is telling you and how to spot confirming and divergent behavior between TSV and Price
- Which settings for TSV may be most appropriate given your trading style
- How to identify ideal TSV patterns for both bullish and bearish trading opportunities
- What multiple timeframe analysis does to enhance the way you trade
Peter Worden – Uncover Resilient Stocks in Today’s Market
Learn how to easily identify stocks that show long-term strength even in unpredictable market downtrends. This video teaches a routine that uses TeleChart tools to sift through thousands of stocks – finding those that have reliably held their price even in severe market swings. Peter Worden steps you through the basics of the routine, then offers ideas for tweaking the results to your specific goals.
Peter Worden – Winning Stock Selection Simplified (Vol I, II & III)
WINNING STOCK SELECTION SIMPLIFIED – VOL I
Duration: 54m 07s
In Winning Stock Selection Simplified, Peter Worden refines two decades of analysis experience into a simple 30 minute routine…one you can easily make a part of your own daily practice. But even Peter admits – you have to peruse lots of individual stock charts– there is no getting around it. If you are afraid of hard work, this video is not for you. If you are the type of person always striving to better your skills, you will learn a lot! Don’t let the hard-work part scare you. Peter Worden doesn’t want to pore over hundreds of charts any more than you do. That’s why he has developed his own techniques to maximize efficiency and save time. He does an excellent job of sharing these with you.
WHAT YOU’LL LEARN:
- A walk through of Peter’s own personal routine for looking for candidates (using TSV and MS) and provides access to the sorting criteria he actually uses
- How to use EasyScan to find Bulls or Bears. Peter shares the criteria he uses to narrow down lists of potential targets.
- How to consolidate stocks you flag along the way into a personal watchlist.
- How to interpret price behavior using Time Segmented Volume, MoneyStream and Balance of Power.
WINNING STOCK SELECTION SIMPLIFIED – VOL II
Duration: 62m 42s
Peek over Peter Worden’s shoulder as he flags his favorite patterns for his WatchList. This video is a great way to get a real-life “feel for charts” as opposed to static, hand-picked, textbook examples. Then, the real value comes when you learn to make your own list. Build it using Peter Worden’s exact MACD Crossover EasyScans and MoneyStream Visual Sorts or tweak them to your specs.
WHAT YOU’LL LEARN:
- How to use a combination of PCFs, EasyScans, and Visual Sorting to bring the cream to the surface
- How to build three Bullish MACD Crossover EasyScans – Peter Worden shares his scans and associated conditions
- How to sort by Visual Value in TC2000 version 7
- Browsing 3-Day charts with an added Volume Surge sort
- Browsing weekly charts and organizing your trade candidates
WINNING STOCK SELECTION SIMPLIFIED – VOL III
Duration: 76m 59s
In this video, Peter Worden shares his personal “TSV Stochastic” EasyScans that he uses to find stocks with room to run – in both directions. Learn by example as he browses more than 80 charts, highlighting those that demonstrate attractive long-term reversal patterns.
WHAT YOU’LL LEARN:
- Peter Worden’s personal “TSV Stochastics” EasyScans that he uses every day.
- The exact PCFs that you can tweak to your personal parameters.
- Sorting tips to focus your analysis on charts with the most favorable patterns.
- Three main indicator behaviors to look for when chart reading.
- Key differences in what to look for in a short-candidate
Delivery Method
– After your purchase, you’ll see a View your orders link which goes to the Downloads page. Here, you can download all the files associated with your order.
– Downloads are available once your payment is confirmed, we’ll also send you a download notification email separate from any transaction notification emails you receive from IMC.sale.
– Since it is a digital copy, our suggestion is to download and save it to your hard drive. In case the link is broken for any reason, please contact us and we will resend the new download link.
– If you cannot find the download link, please don’t worry about that. We will update and notify you as soon as possible at 8:00 AM – 8:00 PM (UTC+8).
Thank You For Shopping With Us!
Be the first to review “Peter Worden – Video Series” Cancel reply
Related Products
Forex & Trading
Forex & Trading
Forex & Trading
Forex & Trading
Forex & Trading


![[Download Now] Peter Worden – Finding and Analyzing Stocks on your PC](https://imc.sale/wp-content/uploads/2022/02/Peter-Worden-–-Finding-and-Analyzing-Stocks-on-your-PC.jpg)




9 reviews for Peter Worden – Video Series
There are no reviews yet.