Tableau and R for Analytics Projects
$8.00
Tableau and R for Analytics Projects
Product Delivery : You will receive a download link via your order email
Should you have any question, do not hesitate to contact us: [email protected]
TABLEAU AND R FOR ANALYTICS PROJECTS
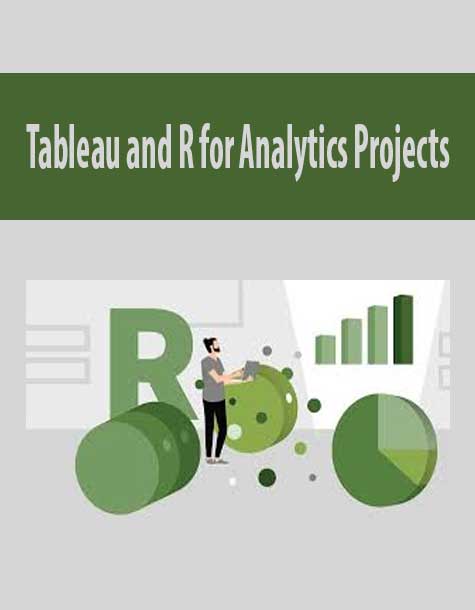
On its own, Tableau is a powerful tool that helps professionals analyze, display, and generally make sense of the data at their fingertips. With the addition of R-a free, open-source language for data science-you can glean even more insights from your data. In this course, learn how to combine the analytical strengths of R with the visualization power of Tableau to analyze and present data more effectively. Instructor Curt Frye demonstrates how to install R and RServe; create a connection between Tableau and R; perform several types of analyses in R, from linear regression to cluster identification; and incorporate those analyses into Tableau visualizations.
Topics include:
Importing data
Creating calculations in R
Creating and visualizing linear regression models
Detecting and visualizing outliers
Defining and visualizing clustering models
Creating a logistic regression model in R
Creating a support vector machine model
Visualizing random forest analysis data in Tableau

Tableau and R for Analytics Projects: Video, PDF´s
Delivery Method
– After your purchase, you’ll see a View your orders link which goes to the Downloads page. Here, you can download all the files associated with your order.
– Downloads are available once your payment is confirmed, we’ll also send you a download notification email separate from any transaction notification emails you receive from IMC.sale.
– Since it is a digital copy, our suggestion is to download and save it to your hard drive. In case the link is broken for any reason, please contact us and we will resend the new download link.
– If you cannot find the download link, please don’t worry about that. We will update and notify you as soon as possible at 8:00 AM – 8:00 PM (UTC+8).
Thank You For Shopping With Us!


7 reviews for Tableau and R for Analytics Projects
There are no reviews yet.