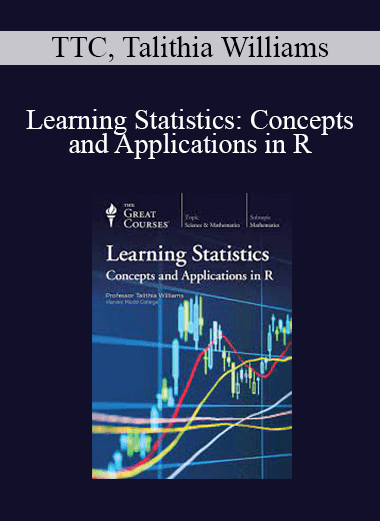
TTC, Talithia Williams – Learning Statistics: Concepts and Applications in R
$40.00 Original price was: $40.00.$17.00Current price is: $17.00.
Digital Download: You will receive a download link via your order email
“Show me the data!” This is coin of the realm in science, medicine, business, education, journalism, and countless other fields. Of course, it’s more complicated than that, because raw data without interpretation is useless. What they mean is “Show me the statistics”—well-founded, persuasive distillations of data…
Learning Statistics: Concepts and Applications in R
24 Lectures
Course Overview
“Show me the data!” This is coin of the realm in science, medicine, business, education, journalism, and countless other fields. Of course, it’s more complicated than that, because raw data without interpretation is useless. What they mean is “Show me the statistics”—well-founded, persuasive distillations of data that support a claim under discussion.
The ability of statistics to extract insights from a random collection of facts is one of the most astonishing and useful feats of applied mathematics. That power is all the more accessible today through the statistical programming language R, a free, open-source computer language with millions of users worldwide—everyone from students and nonprofessionals to managers and researchers at the forefront of their disciplines.
In this era of big data, with a solid understanding of statistics and the tools for interpreting data, you don’t have to trust someone else’s analysis of medical treatments, financial returns, crop yields, voting trends, home prices, or any other interpretation of data. You can do it yourself.
Designed for those who appreciate math or want an introduction to an essential toolkit for thinking about the uncertainty inherent in all sorts of information, Learning Statistics: Concepts and Applications in R teaches you elementary statistical methods and how to apply them in R, which is made even more powerful when combined with the user interface of RStudio. (Both R and RStudio are free and downloadable for multiple platforms.)
In 24 challenging and in-depth half-hour lectures, award-winning Professor Talithia Williams of Harvey Mudd College walks you through major concepts of an introductory college-level statistics course, and beyond, using examples developed and presented in R. Compared with “canned” statistics packages, R brings users into a more hands-on, mind-engaging approach that is becoming the standard at top-tier statistics programs throughout the country.
An Associate Professor of Mathematics and the Associate Dean for Research and Experiential Learning at Harvey Mudd, Dr. Williams is a nationally recognized innovator in statistics education, noted for her popular TED Talk, “Own Your Body’s Data,” and she is cohost of the PBS NOVA series NOVA Wonders.
R You Ready for a Fresh Approach to Statistics?
In a course that repays multiple viewings, Professor Williams presents the most widely-used statistical measures, concepts, and techniques: how and when to use them, what they mean, and how to recognize when arguments or conclusions based on statistical data are suspect or wrong.
Learning Statistics will especially benefit those who want to go beyond a beginner level and get a deeper, fuller understanding of the discipline. And for anyone who learned statistics many years ago, this course gives an updated experience of what is going on in the field today and how user access to the R programming language is transforming the everyday practice of statistics.
The special advantages of this video-only course include:
- Statistics concepts combined with R examples: Viewers get a two-for-one combination of thorough grounding in statistical concepts with ground-up demonstrations of how problems are solved with the R programming languge
- A guided tour of R in action: Viewers get a gentle introduction to R in use—from how to download R and RStudio, to importing and exporting data, writing code, and generating plots. All examples in the course are conducted in R.
- Enhanced graphics: On-screen graphics are based on outputs from RStudio, but with frequent enhancements to make the visuals even easier to read and understand.
- Large screen or handheld: The presentation has been optimized for everything from TVs and computers to mobile devices, meaning you can watch it on a handheld device with the same comfort and clarity as on a television screen.
- Links to the R community: When you finish these lectures, you are not on your own. Professor Williams helps you join the worldwide community of R users, who have been advising the novice and expert alike for two decades.
Professor Williams has organized the course so that it can be taken straight through, proceeding from elementary descriptive statistics to standard and advanced techniques in statistical inference. Those with a background in other statistics software may also find the progression very helpful, while students seeking help in specific areas can jump in and out at any point throughout the course.
Discover a Powerful Set of Statistical Tools
Learning Statistics begins with an overview of the field, including how to calculate and display summaries of data. Professor Williams then introduces R and discusses its advantages over other statistical analysis packages. Unlike many such products, which are costly to purchase and upgrade, R and RStudio are entirely free. Before the end of Lecture 2, you are up and running R code.
The next six lectures cover descriptive statistics and probability, in which you learn to draw conclusions from a given sample of data by using visual aids such as histograms, scatterplots, and box plots. Employing concepts such as the normal distribution, central limit theorem, and correlation, you explore a variety of probability distributions and graphical analysis techniques. You are introduced to the formulas for these operations as well as the simple R commands that run them automatically.
Starting in Lecture 8, you explore the remarkable power of statistics to make inferences about an entire population, based on a small sample. You discover how to frame a hypothesis, build a model, and deduce propositions from the resulting data. You study simple linear regression, multiple linear regression, ANOVA (analysis of variance), and other cornerstone techniques, while also using R to run simulations of many different scenarios from the R Datasets Package.
In the last third of the course, you learn how statisticians go beyond what beginners are often taught, developing branches of applied statistics that have spun off to form their own immensely productive specialties. These include:
- Experimental design: While there are many techniques for analyzing data you already have, even more powerful is designing an experiment to decide how data is collected from the start. Consider such elements of good design as blocking, randomization, and replication to ensure that your experiment produces sound statistical results.
- Spatial statistics: Maps have always been information-rich artifacts, but they are now more useful than ever thanks to the advent of GPS-enabled data-gathering devices and powerful computers, combined with a panoply of statistical tools for treating spatial autocorrelation as a rich new source of information.
- Time series analysis: Just as fascinating as spatial data is information collected sequentially over time—in finance, meteorology, biology, agriculture, and other fields. One of the most important goals of time series analysis is forecasting, which extracts short- and longer-term patterns in the data.
- Bayesian inference: Textbook statistics is often based on a “frequentist” paradigm, in which sampling is theoretically unlimited. But for many real-life situations, your information is almost always incomplete, and likely to be revised. This is the forte of Bayesian inference.
You close the course with a lecture on how to customize R to select and combine information in whatever way you want, so that R best serves your own needs.
Dr. Williams has made it her life’s work to get students, parents, educators, and the community at large excited about mathematics and especially statistics, which she describes as “a powerful framework for THINKING—for reaching insights and solving problems.” As witnessed by her TED Talk, which has been viewed over one million times, Dr. Williams has a gift for demystifying statistics and making it relevant to everyone—because whenever you hear a statistical argument that directly affects your health, livelihood, autonomy, or your firmly held beliefs, you should say, “Show me the data, so I can decide for myself.” With this course, you will be able to do exactly that.
Get download TTC, Talithia Williams – Learning Statistics: Concepts and Applications in R at IMC.sale right now!
Delivery Method
– After your purchase, you’ll see a View your orders link which goes to the Downloads page. Here, you can download all the files associated with your order.
– Downloads are available once your payment is confirmed, we’ll also send you a download notification email separate from any transaction notification emails you receive from IMC.sale.
– Since it is a digital copy, our suggestion is to download and save it to your hard drive. In case the link is broken for any reason, please contact us and we will resend the new download link.
– If you cannot find the download link, please don’t worry about that. We will update and notify you as soon as possible at 8:00 AM – 8:00 PM (UTC+8).
Thank You For Shopping With Us!
Be the first to review “TTC, Talithia Williams – Learning Statistics: Concepts and Applications in R” Cancel reply
Related Products
Everything Else
Medical & Health
Everything Else
Medical & Health
TTC – Outsmart Yourself: Brain-Based Strategies to a Better You
Psychology & Body Language
Psychology & Body Language
Psychology & Body Language
Psychology & Body Language



7 reviews for TTC, Talithia Williams – Learning Statistics: Concepts and Applications in R
There are no reviews yet.