vBox Indicator
$34.00
vBox Indicator
Product Delivery: You will receive a download link via your order email
Should you have any question, do not hesitate to contact us: [email protected]
vBox Indicator
PRODUCT DESCRIPTION
A method by which to use volume to determine significant areas of support / resistance on intra-day charts.
Volume is an important indicator of market sentimentality and may be used as a tool to determine potential areas of support and resistance.
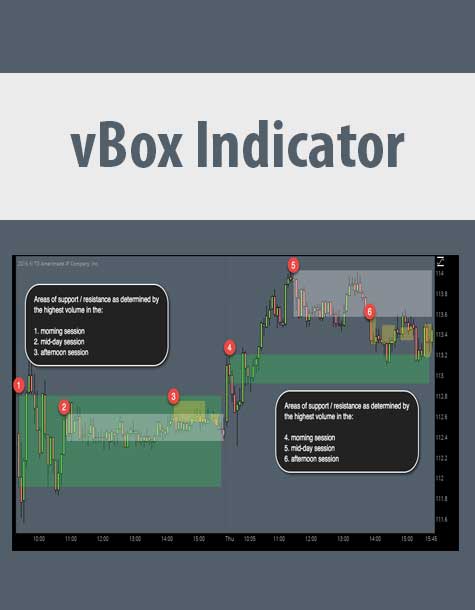
The trading day is divided into three sessions: morning (0930 – 1100), mid-day (1100 – 1400), and afternoon (1400 – 1600). The highest 5-minute volume in each session defines the greatest area of market interest and will show areas of significant support / resistance.
This indicator will work on 5 minute charts or below. The green boxes show the major areas from the morning session; gray boxes are from the mid-day session; and yellow boxes are from the late-afternoon session. The gray lines show the major support / resistance areas from the previous day.
The session colors may be adjusted from within the “Globals” section of the script settings panel.
The extension lines showing the areas of support / resistance from the prior day’s trading session may be enabled or disabled from within the script settings pane as well.
Note: This does not include the custom volume script.
This vBox indicator is for ThinkorSwim only
Delivery Method
– After your purchase, you’ll see a View your orders link which goes to the Downloads page. Here, you can download all the files associated with your order.
– Downloads are available once your payment is confirmed, we’ll also send you a download notification email separate from any transaction notification emails you receive from IMC.sale.
– Since it is a digital copy, our suggestion is to download and save it to your hard drive. In case the link is broken for any reason, please contact us and we will resend the new download link.
– If you cannot find the download link, please don’t worry about that. We will update and notify you as soon as possible at 8:00 AM – 8:00 PM (UTC+8).
Thank You For Shopping With Us!


8 reviews for vBox Indicator
There are no reviews yet.